Sensory Journeys
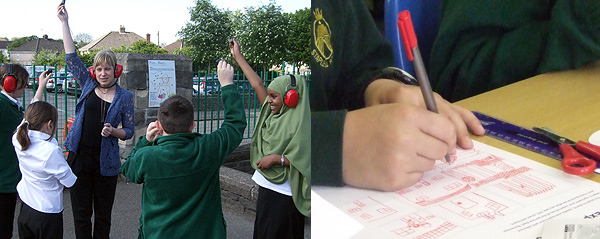
Sensory Journeys (2009-10) was a one year project by the artist Christian Nold, commissioned by Sustrans the UK sustainable transport charity. The project involved Christian Nold & Sustrans Bike-It team working closely with four schools in Bristol on a series of creative workshops that took place in and out of school.
Do people have different sensory experiences and emotional relationships with their local area depending on their mode of travel?
To answer this question, Christian Nold developed an innovative experiential methodology & toolkit composed of activities, technologies and visualisations, designed to allow the children to document their experiences. During intensive, week long, workshops at each school, the children learned how to articulate and represent the sensory experiences that occured on their journey to school. The custom built Sensory Journeys web application functioned as a spatial archive to bring together all the collective experiences of the children. After all the workshops, Christian Nold analysed the material and used it to design a series of printed maps that break down the experiences by mode of transport. Tese maps were presented to the schools to initiate discussions about the sensory, emotional and social impact of travel choices for children, teachers, governors and local politicians. The aim of the project is to set up a national network of schools using this system to document and compare their transport provision and discuss new solutions. If you would like to join the project please contact Sustrans and Christian Nold.
Collective Sensory Experience Maps:
Click to view, download and print
New Oak Primary School:
New Oak Walking Map (PDF)
New Oak Driving Map (PDF)
Staple Hill Primary School:
Staple Hill Walking Map (PDF)
Staple Hill Driving Map (PDF)
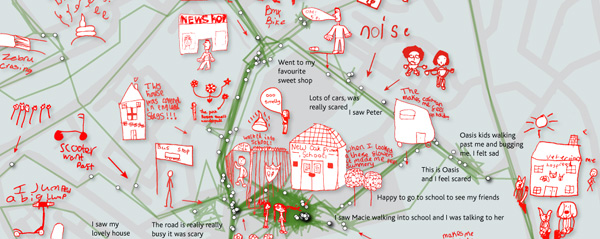
Looking at the maps, there is clear difference between the modes of transport. The Walking Maps for both schools show a much larger number of interactions with people, plants and animals as well as as sensory events such as weather, noisees and smells. In comparison the Driving Maps show mainly buildings and sights. The experience of being driven to school appears to be like a teleport with a beginning and and end and little in between.
--------------------------------------------------------------
Guide to the Sensory Journeys Application:
When viewing the website, 3 types of data are visible on the map:
-GPS tracks with Waypoints (blue line with purple dots)
-Drawings (red lines)
-Point based Comments (smiley faces with text when clicked)
The children carried GPS units with a button that they pressed to mark
the 5 most important experiences with a digital waypoint. When arriving
at school the children then illustrated their experiences using drawings
with a red pen made on special greyscale printed maps. These maps were
then scanned and uploaded to the website. The software reads the QR code
on the map and geo locates the childrens' drawings and places them onto
the map. I recommend clicking on the name of a school and then
comparing the drawings via the different forms of transport by clicking
the tabs on the top left. Please note the software is mainly a spatial
repository. To create the final maps required a lots of work in
analysing and designing the printed maps that can be downloaded above.
--------------------------------------------------------------
Credits:
Overall Project & Software Concept & Design & Map Design: Christian Nold
www.softhook.com
Web Programming: Andy Allan
www.gravitystorm.co.uk
Map Data: OpenStreetMap - Creative Commons Attribution-Share Alike www.openstreetmap.org
The application uses Walking Papers by Michal Migurski www.walking-papers.org
Sustrans's vision is a world in which people choose to travel in ways that benefit their health and the environment. To find out more: www.sustrans.org.uk
Sensory Journeys is supported by Arts Council England, Bristol City Cycling Demonstration Fund and The Ernest Cook Trust